
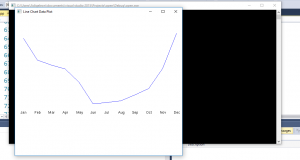
Merhaba arkadaşlar bu yazımda c++ ile “LineChart” doğrusal grafik nasıl çizilir bundan bahsedeceğim.Önceki yazımda visual studio ya c++ eklentisi ve freeglut kütüphanelerinin nasıl eklendiğini anlatan bir video linki paylaşmıştım. Bu kodu çalıştırarak sonucu görebilirsiniz.
|
1 2 3 4 5 6 7 8 9 10 11 12 13 14 15 16 17 18 19 20 21 22 23 24 25 26 27 28 29 30 31 32 33 34 35 36 37 38 39 40 41 42 43 44 45 46 47 48 49 50 51 52 53 54 55 56 57 58 59 60 61 62 63 64 65 66 67 68 69 70 71 72 73 74 75 76 |
#include <GL/glut.h> GLsizei winWidth = 600, winHeight = 500; // Initial display window size. GLint xRaster = 25, yRaster = 150; // Initialize raster position. GLubyte label[36] = { 'J', 'a', 'n', 'F', 'e', 'b', 'M', 'a', 'r', 'A', 'p', 'r', 'M', 'a', 'y', 'J', 'u', 'n', 'J', 'u', 'l', 'A', 'u', 'g', 'S', 'e', 'p', 'O', 'c', 't', 'N', 'o', 'v', 'D', 'e', 'c' }; GLint dataValue[12] = { 420, 342, 324, 310, 262, 185, 190, 196, 217, 240, 312, 438 }; void init(void) { glClearColor(1.0, 1.0, 1.0, 1.0); // White display window. glMatrixMode(GL_PROJECTION); gluOrtho2D(0.0, 600.0, 0.0, 500.0); } void lineGraph(void) { GLint month, k; GLint x = 30; // Initialize x position for chart. glClear(GL_COLOR_BUFFER_BIT); // Clear display window. glColor3f(0.0, 0.0, 1.0); // Set line color to blue. glBegin(GL_LINE_STRIP); // Plot data as a polyline. for (k = 0; k < 12; k++) glVertex2i(x + k * 50, dataValue[k]); glEnd(); glColor3f(1.0, 0.0, 0.0); // Set marker color to red. for (k = 0; k < 12; k++) { // Plot data as asterisk polymarkers. glRasterPos2i(xRaster + k * 50, dataValue[k] - 4); glutBitmapCharacter(GLUT_BITMAP_9_BY_15, '*'); } glColor3f(0.0, 0.0, 0.0); // Set text color to black. xRaster = 20; // Display chart labels. for (month = 0; month < 12; month++) { glRasterPos2i(xRaster, yRaster); for (k = 3 * month; k < 3 * month + 3; k++) glutBitmapCharacter(GLUT_BITMAP_HELVETICA_12, label[k]); xRaster += 50; } glFlush(); } void winReshapeFcn(GLint newWidth, GLint newHeight) { glMatrixMode(GL_PROJECTION); glLoadIdentity(); gluOrtho2D(0.0, GLdouble(newWidth), 0.0, GLdouble(newHeight)); glClear(GL_COLOR_BUFFER_BIT); } void main(int argc, char** argv) { glutInit(&argc, argv); glutInitDisplayMode(GLUT_SINGLE | GLUT_RGB); glutInitWindowPosition(100, 100); glutInitWindowSize(winWidth, winHeight); glutCreateWindow("Line Chart Data Plot"); init(); glutDisplayFunc(lineGraph); glutReshapeFunc(winReshapeFcn); glutMainLoop(); } |
Başarılı yazı devamı yok mu